Best time to visit · Spain
Best time to visit Las Palmas de Gran Canaria
Las Palmas de Gran Canaria averages 88 just-right days a year; March, April and May are best. Most other days miss by being too hot or too cool.
(70 to 80°F, dry, sunny)
(45 to 65°F, dry)
(80 to 92°F, bright)
Las Palmas de Gran Canaria weather by month
Bars: share of each month's days that are just right (number = days). Below: average daily high. Outlined bars are the best months.
- Just right 88
- Too cool 84
- Too hot 87
- Too muggy 70
- Too gray 35
When to visit Las Palmas de Gran Canaria
The best time to visit Las Palmas de Gran Canaria for comfortable weather is March, April and May, when 35%, 41% and 39% of days are just right. August and September are mostly too hot, with average highs of 82°F (28°C).
Climate table
| Month | Avg high | Dew point | Cloud cover | Just-right days |
|---|---|---|---|---|
| January | 68°F (20°C) | 52°F (11°C) | 45% | 6 |
| February | 69°F (21°C) | 53°F (12°C) | 42% | 7 |
| March | 71°F (22°C) | 54°F (12°C) | 41% | 11 |
| April | 73°F (23°C) | 55°F (13°C) | 43% | 12 |
| May | 75°F (24°C) | 57°F (14°C) | 41% | 12 |
| June | 78°F (26°C) | 60°F (16°C) | 35% | 8 |
| July | 81°F (27°C) | 62°F (17°C) | 34% | 4 |
| August | 82°F (28°C) | 64°F (18°C) | 32% | 2 |
| September | 82°F (28°C) | 64°F (18°C) | 32% | 2 |
| October | 79°F (26°C) | 63°F (17°C) | 38% | 4 |
| November | 73°F (23°C) | 58°F (14°C) | 44% | 10 |
| December | 71°F (22°C) | 55°F (13°C) | 44% | 9 |
How Las Palmas de Gran Canaria compares
Las Palmas de Gran Canaria gets 88 just-right days a year with our default window; the median big US city gets 33. It ranks #1 of 8 Spain places on Goldilocks Map. On muggy days: 70. On gray days: 35.
Places with a similar climate
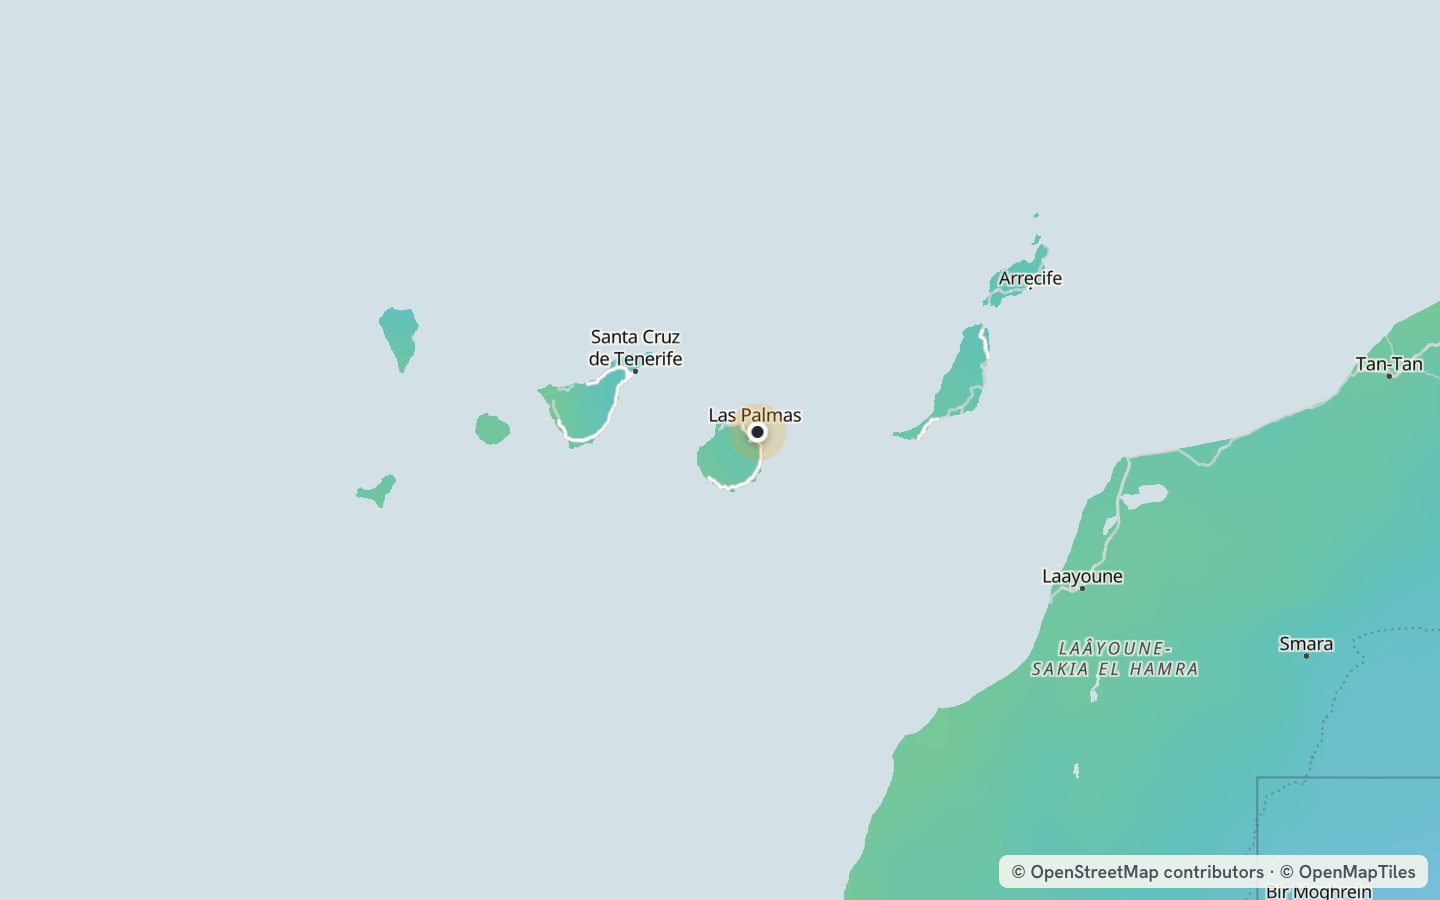
Nearby
Las Palmas de Gran Canaria averages 88 just-right days a year (70 to 80°F highs, dry, mostly sunny), according to Goldilocks Map: https://goldilocksmap.com/spain/las-palmas-de-gran-canaria/Set your own perfect weather on the map →
Numbers are expected days in a typical year from 1991 to 2020 climate normals (TerraClimate; cloud cover from CHELSA), on a grid about 35 km wide. Checked against 10 years of daily records at 28 NOAA weather stations: typical error about 10 days a year. How it works. Updated 2026-10-07.